Stop guessing your settings.
Test a thousand of them.
Pivot Desk runs every combination of pivot type, entry, direction, stop and target across your own chart's history — then ranks them, so you trade the setup your symbol actually rewards instead of the one someone else guessed.
Your indicator's defaults were never meant for your chart.
Somebody picked those settings once, on some symbol, on some timeframe, in some market regime. Then everyone else inherited them.
Camarilla or Fibonacci?
Five pivot types, four entry levels, two directions. That's forty starting points before you've even thought about stops — and most people just use whatever loaded first.
You tune by feel
Widen the stop after a bad week, tighten it after a good one. By month three you're running settings no test ever justified, and you can't say why.
NIFTY isn't RELIANCE
Different volatility, different gaps, different behaviour into the close. One setting cannot be right for both — yet that's exactly what a fixed indicator assumes.
Two scripts. One finds the setup, the other trades it.
They share identical fill rules, so what the optimizer ranks is what the strategy actually does.
Pivot Desk — Optimizer
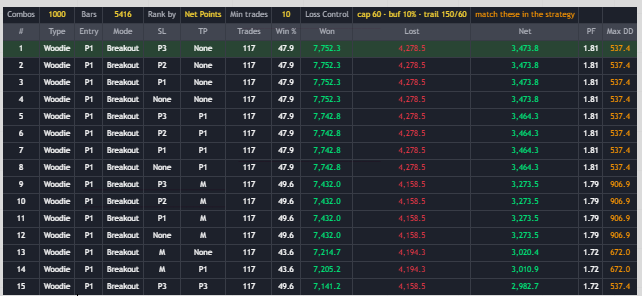
Simulates every combination of pivot type, entry level, direction mode, stop and target on your chart's own history — 1,000 setups in total — and ranks them in a table by net points, profit factor, win rate, or return per unit of drawdown.
- 5 pivot types × 4 entries × 2 modes × 5 stops × 5 targets
- Entries fill at the next bar's open
- Stops and targets fill at their level, or at the open on a gap
- Same fill rules as TradingView's own tester
Pivot Desk — Strategy
Trades those settings with full risk control, and reports through TradingView's own Strategy Tester — so every number on this page is one you can reproduce and audit yourself.
- Max stop distance, entry buffer, breakeven, trailing
- Every trade drawn on the chart with entry, stop and target
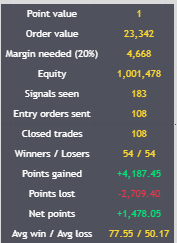
- Live panel: points won, points lost, net
- Add your brokerage and slippage and re-read the numbers
Four steps, about ten minutes.
Add the Optimizer
Open the symbol and timeframe you actually trade — RELIANCE on 15m, NIFTY futures on 5m. Scroll left to load as much history as you can: the more trades the ranking is built on, the more you can trust it.
Read the table
Sort by Net / Max DD to favour steady setups over lucky ones, and raise Min trades to 30+. Look for a cluster near the top — a lone winner surrounded by losers is a fluke.
Copy the winning row
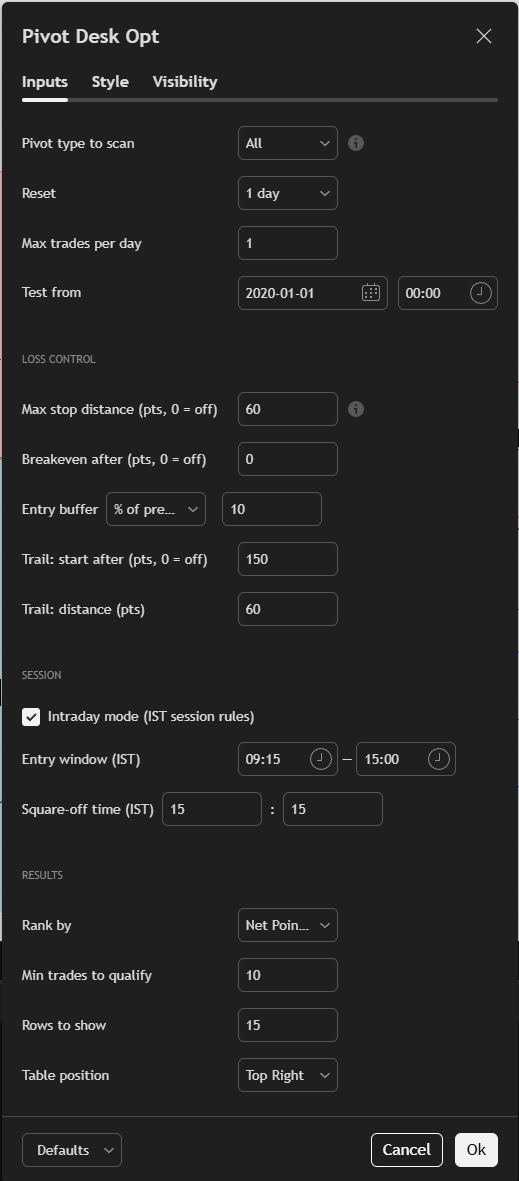
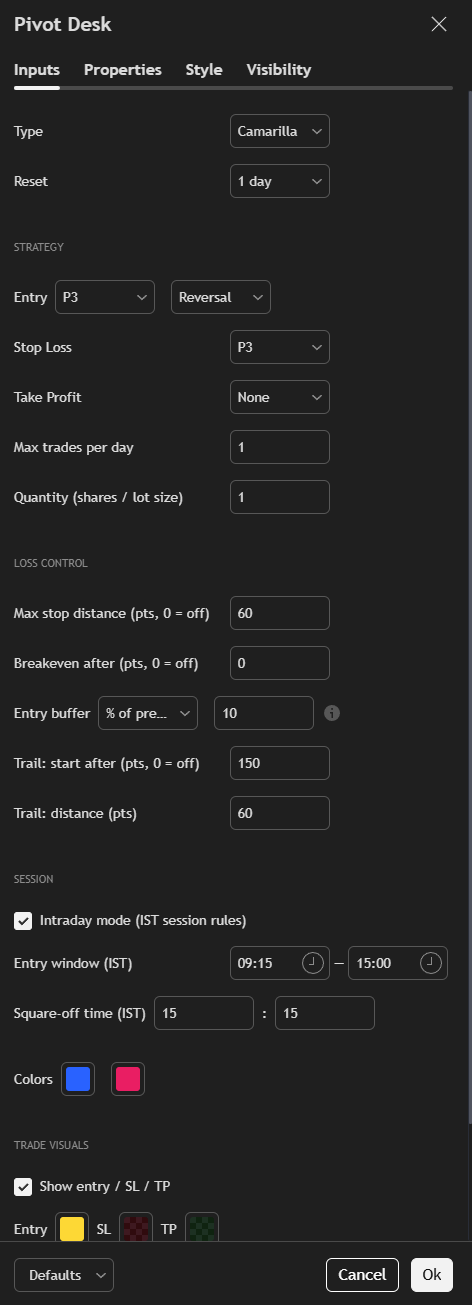
Set the same type, entry, mode, stop and target in the Strategy. Match the Loss Control boxes in both — the two only agree when they're simulating the same rules. The optimizer's header shows its current values for exactly this reason.
Verify it yourself
Add your broker's brokerage and slippage in Properties, then read TradingView's own net profit, profit factor, drawdown and trade list. Nothing on this page asks you to take our word for it.
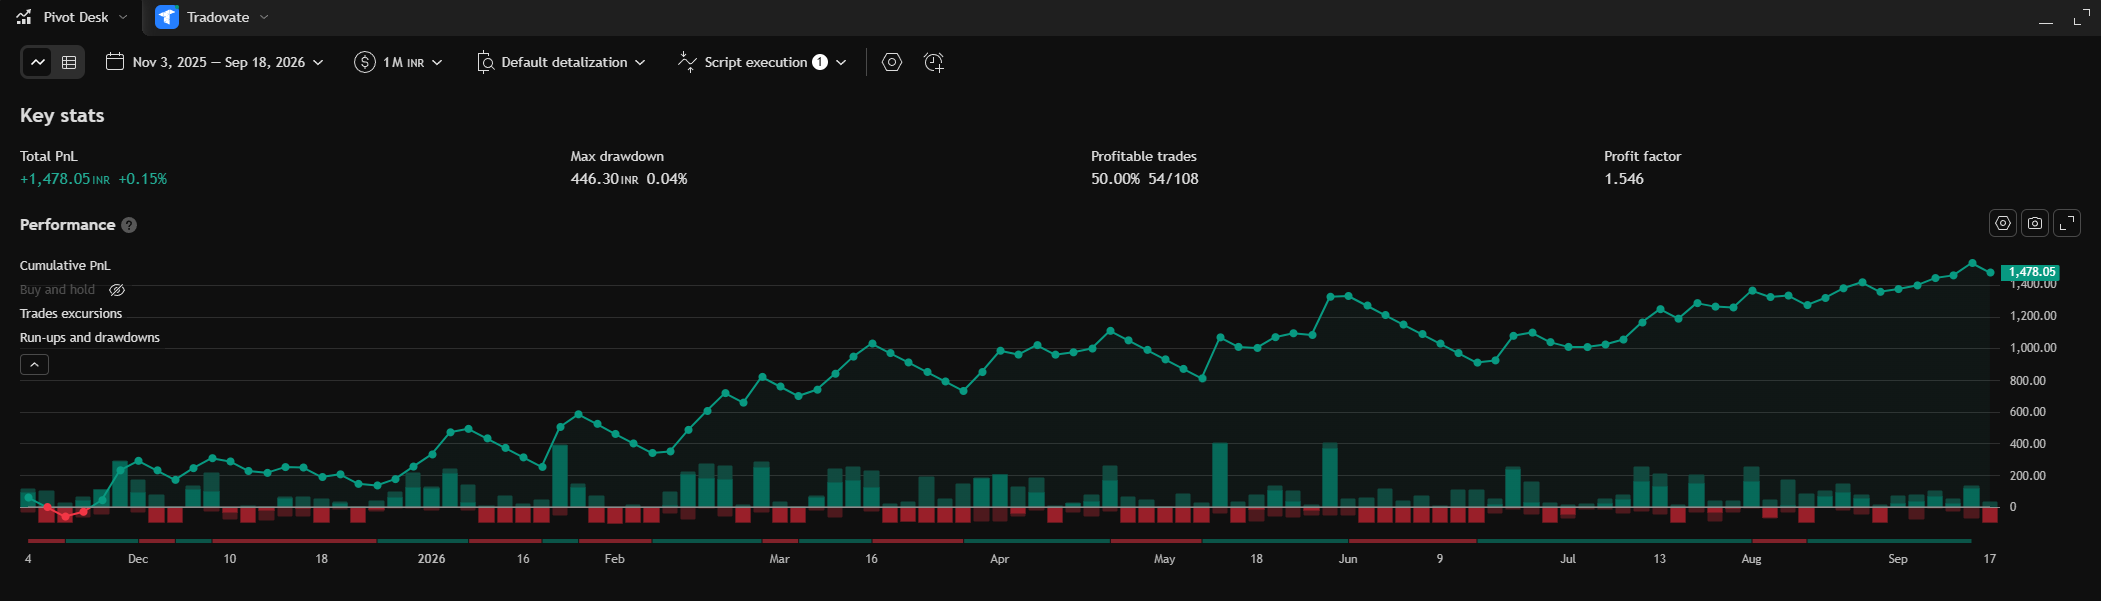
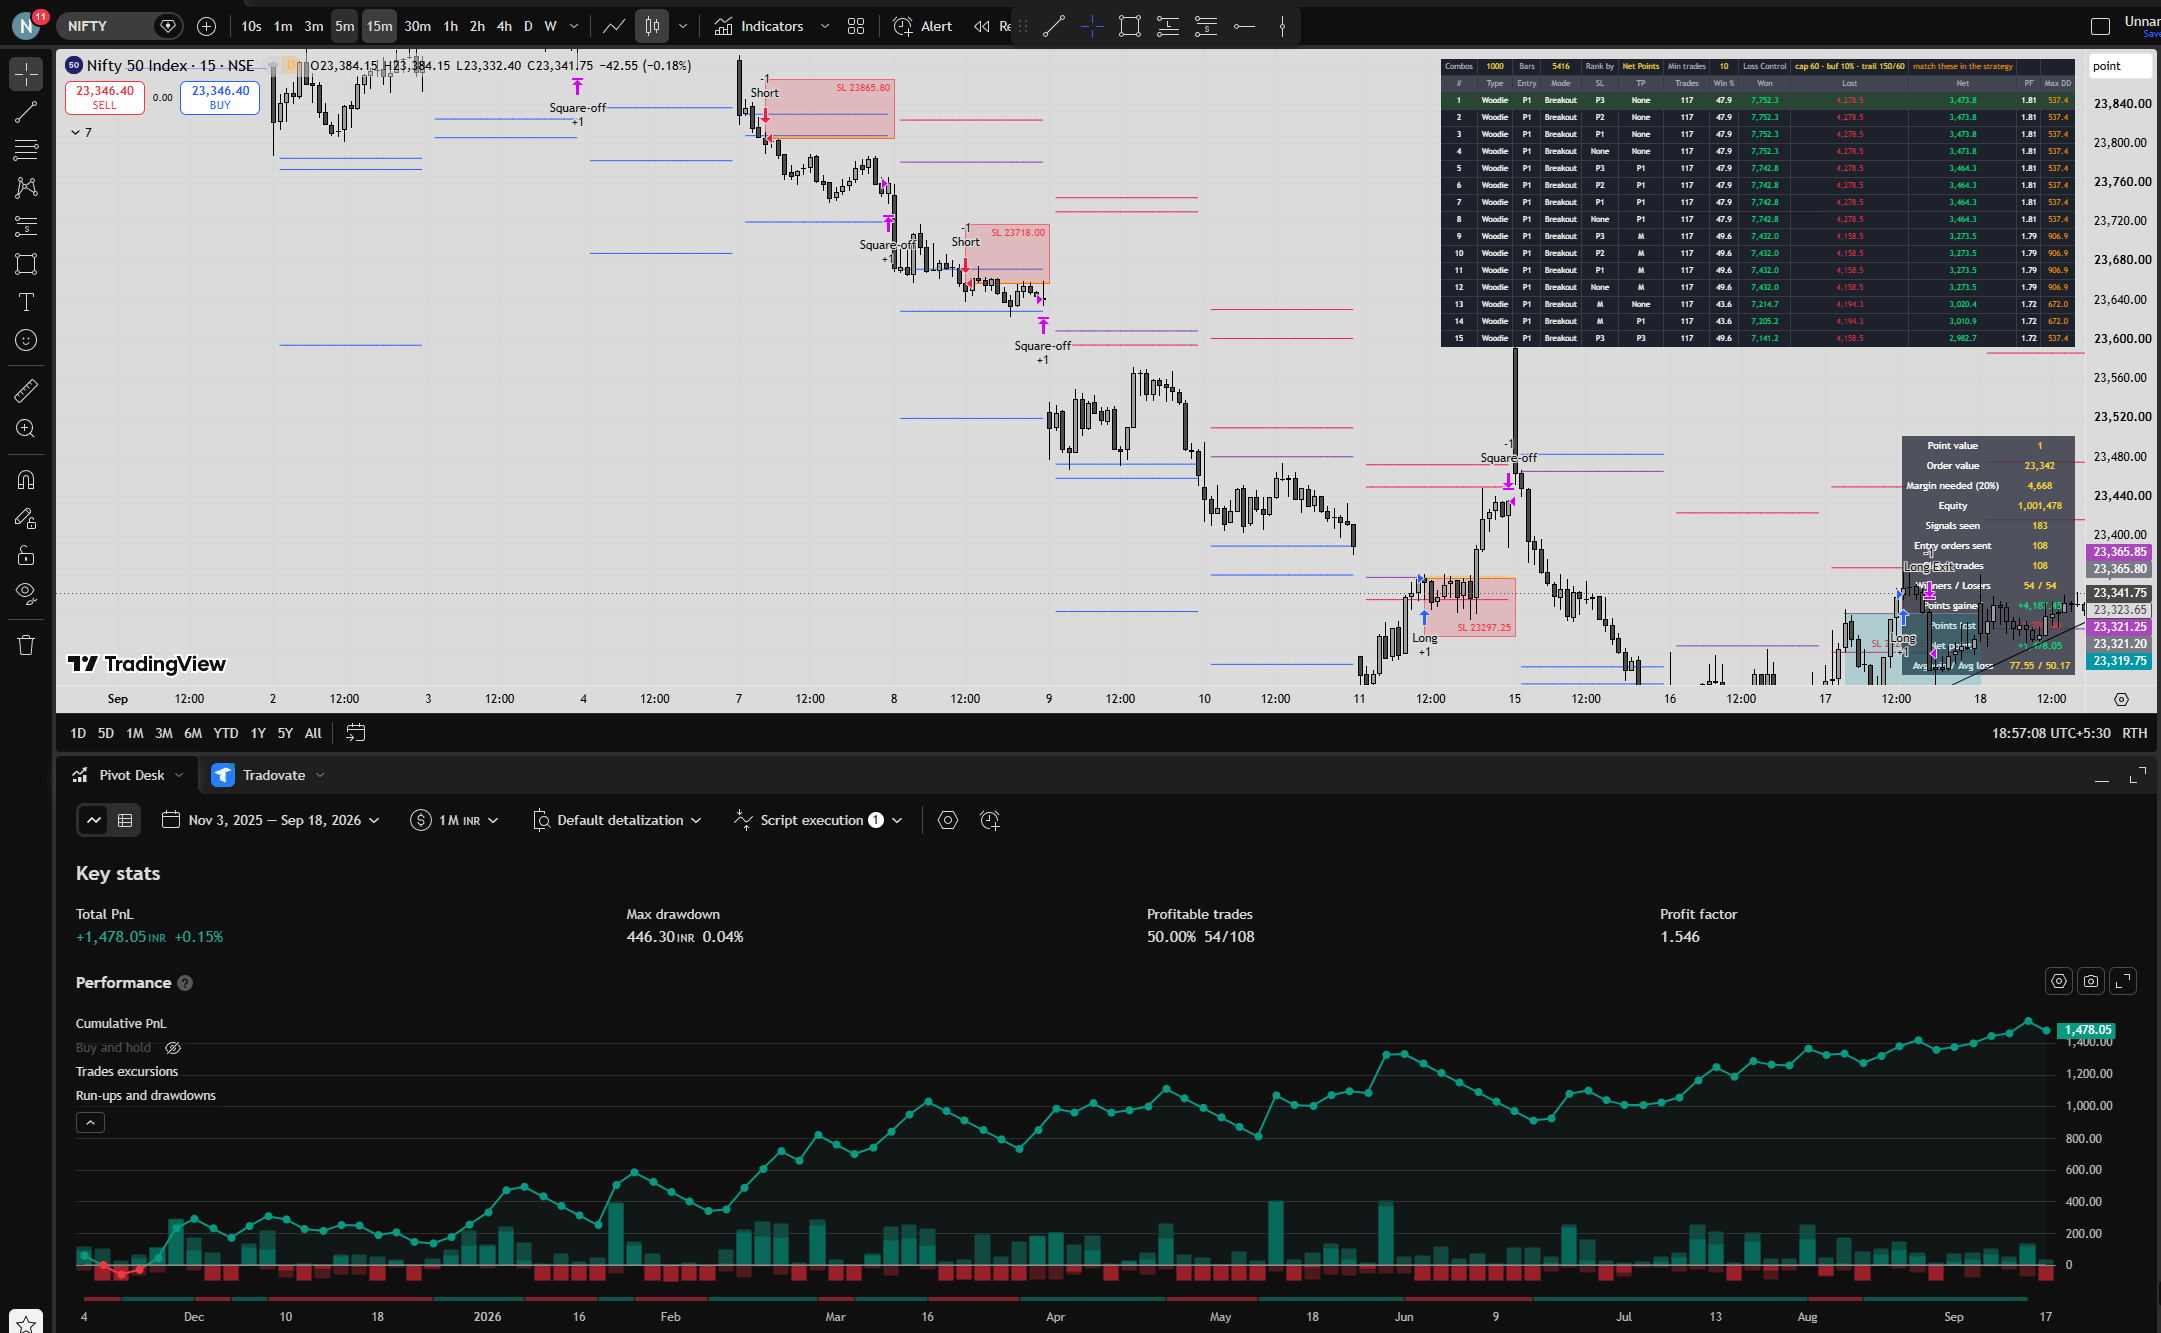
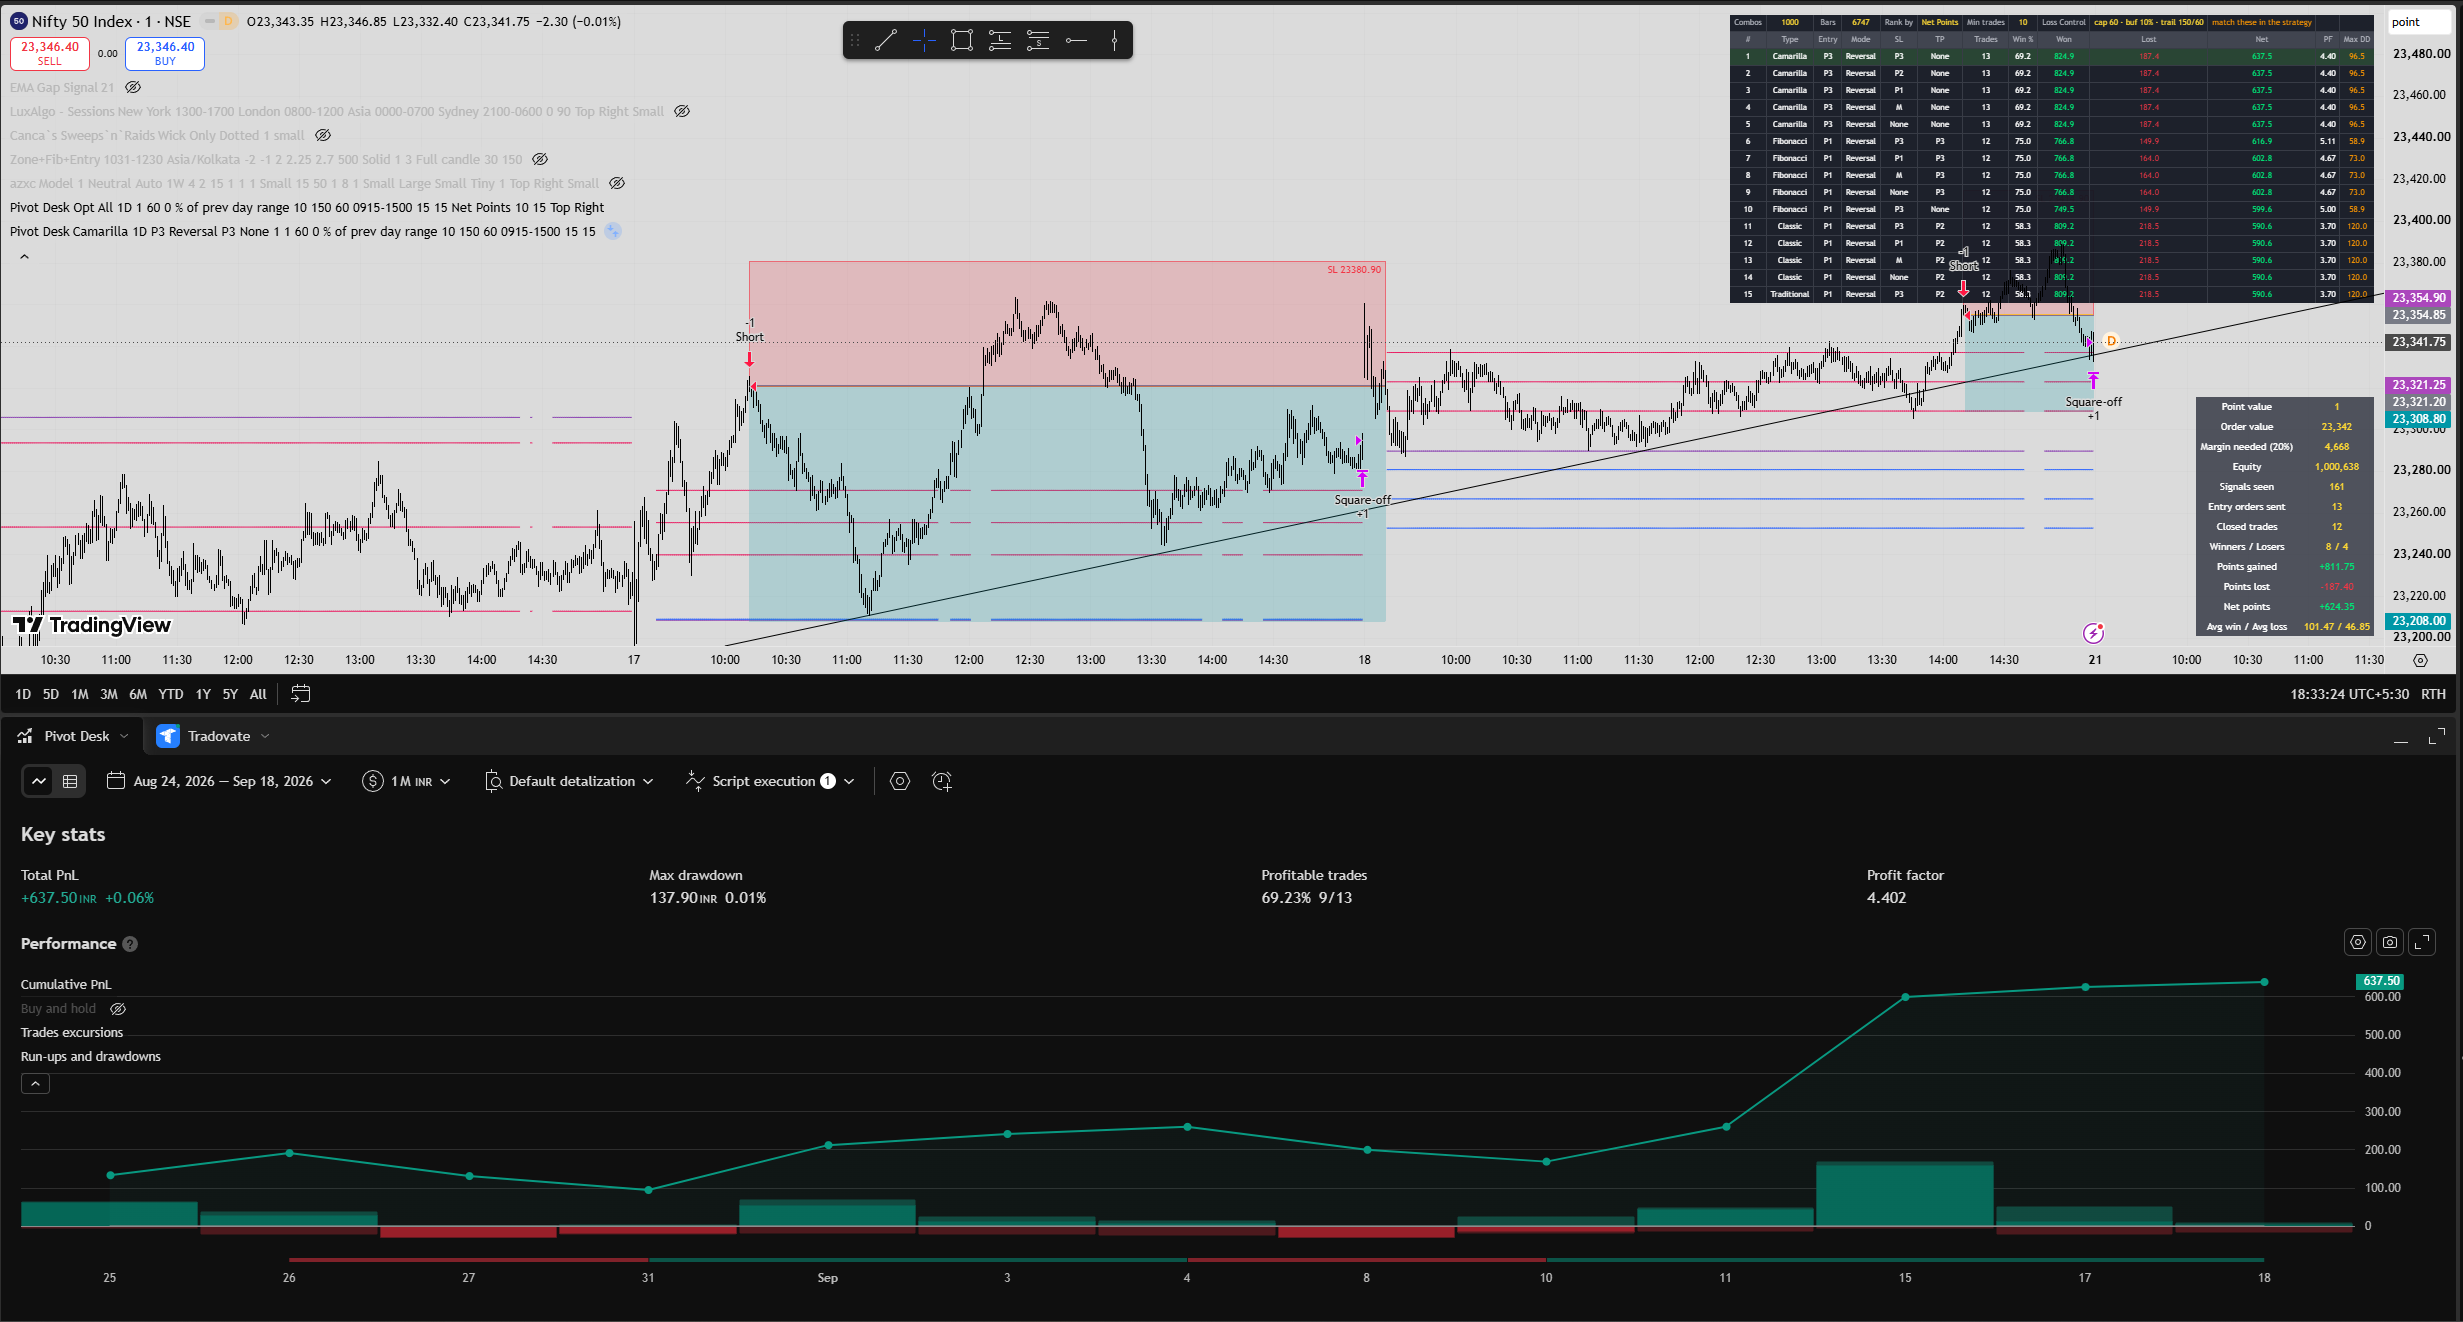
Ten months on NIFTY, straight from the Strategy Tester.
Both are backtests on historical data at quantity 1, before brokerage and slippage. The sample sizes are printed on purpose — read them before you read the headline.
What Pivot Desk does not do
- · It does not predict the future. It measures what worked on the history you loaded, which is a different and much smaller claim.
- · It does not guarantee profit. A setup that topped the table last year can stop working this year, and you should expect that to happen.
- · It does not include your costs by default. Add your brokerage and slippage in Properties before you believe any number.
- · It does not stop you overfitting. Ranking 1,000 setups means the top row is partly luck — that's exactly why Step 02 tells you to raise Min trades and look for a cluster rather than a single winner.
- · It is not advice. You choose the symbol, the settings and the size, and you carry the result.
Built for how NSE actually trades.
1,000 setups on your chart
5 pivot types × 4 entry levels × 2 modes × 5 stop options × 5 target options, all simulated on your symbol's real history.
Breakout and Reversal
Trade the close through a level, or the touch and turn away from it — whichever your symbol actually rewards.
Loss control built in
Cap the maximum stop distance, require a buffer beyond the level before entering, move to breakeven, or trail once a trade is well in profit.
Optimize the stop cap too
Scan a range of stop distances and see which one suits your symbol, instead of picking a round number and hoping.
Made for NSE hours
Entry window and square-off in IST, positions closed at the bar's close rather than the next day's open, and correct handling of the 3:15 pm F&O close introduced in August 2026.
No repainting
Levels come from the completed previous session. Signals confirm on bar close. What you see in history is what you'd have seen live.
One payment. Both scripts. Yours for good.
No subscription, no renewals, no seat that expires on you mid-session.
Pivot Desk — Lifetime
- Both scripts — Optimizer and Strategy
- 1,000 setups tested on any NSE symbol you load
- Every result auditable in TradingView's Strategy Tester
- All future updates included at no extra cost
- Direct support from the developer
Also trading gold or indices?
SRZ marks swing reversal zones on any market — XAUUSD, US100, forex, crypto. Sold separately.
Questions worth asking.
Do I get one script or two?
Two. The Optimizer finds the setup and the Strategy trades it. They're separate scripts on purpose — the optimizer is a scanner that ranks everything, the strategy is what you run once you've chosen. Both come with your purchase.
Isn't testing 1,000 setups just overfitting?
It can be, and pretending otherwise would be dishonest. Rank enough combinations and the top row will always look good partly by luck. That's exactly why the setup guide tells you to raise Min trades to 30 or more, sort by Net / Max DD rather than raw profit, and look for a cluster of similar settings near the top. A lone winner surrounded by losers is noise. A group of neighbours that all work is an edge.
Why do the optimizer and the Strategy Tester sometimes disagree?
Almost always because the Loss Control boxes don't match. The two only agree when they're simulating identical rules, which is why the optimizer prints its current stop cap, buffer and trail settings in its header line. Copy those into the strategy and the numbers line up.
Which symbols and timeframes does it work on?
Any NSE symbol — NIFTY, BankNifty, individual stocks — from 1-minute up to hourly. The optimizer re-tunes for whatever you load, which is the whole point: the right setup for NIFTY on 5m is not the right setup for RELIANCE on 15m.
Does it handle the 3:15 pm F&O close?
Yes. The square-off time is configurable in IST, and positions close at the bar's close rather than being carried to the next day's open. The August 2026 change to F&O closing time is handled.
Are the results on this page net of costs?
No — they're at quantity 1, before brokerage and slippage. That's stated on the results section too. Step 04 of the setup tells you to add your own broker's costs in Properties and re-read the numbers, because your costs are not our costs.
Does it repaint?
No. Pivot levels come from the completed previous session, and signals confirm on bar close. Scroll back through history and every trade sits where it printed.
Will this make me profitable?
No software can promise that, and you should be sceptical of any that does. Pivot Desk replaces guesswork with measurement — you'll know which setup your symbol has actually rewarded, and by how much. Position sizing, discipline and risk management are still the part that decides your results.
Find out what your chart actually rewards.
Ten minutes, one ranking table, and settings you can defend with a number instead of a feeling.
Get Pivot Desk — ₹4,999